t-statistics and how to find some relationship?
Written on November 8th, 2019 by szarki9
But how to check whether we can apply linear regression and whether there is a relationship between X and Y or not? This is the reason I did mention hypothesis testing in one of the posts before. So we will test the existence of the relationship using hypothesis testing.
Let’s take the null hypothesis H: There is no relationship between X and Y, and the alternative hypothesis K: There is some relationship between X and Y. This will lead to test H: β = 0 and K: β != 0. We need to compute t-statistics here, which measures the number of standard deviations that β is away from 0. In order to measure that we need to divide our estimated parameter β by its standard error*. Then we compare the results with t-student distribution for n-2 degrees of freedom and then we have basics to reject or not the null hypothesis. Rather an easy one right?
*standard error (SE) - tells us the average amount that this estimated parameter differs from the actual value of the parameter.
Others interesting facts about t-student distribution:
So, t-student distribution, from what I have found out, is used for hypothesis testing or for estimation of uncertainty of measurement (<- that is our case guys).
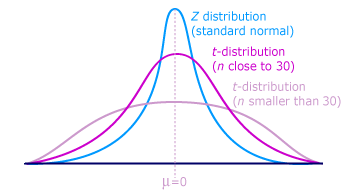
Other crucial to know fact is that when we have more than 30 degrees of freedom, t-distribution is very close to normal distribution so we can use normal distribution in our work instead of t. Look at the picture below to see how t-student looks like for different degrees of freedom.

Photo borrowed from: link.
thanks again, see you soon!
xoxo,
szarki9

